Scales of Design - Architecture Course Spring 2024
Midterm Assignments
Professor Bimal Mendis
HUMAN OF THE ANTHROPOCENE
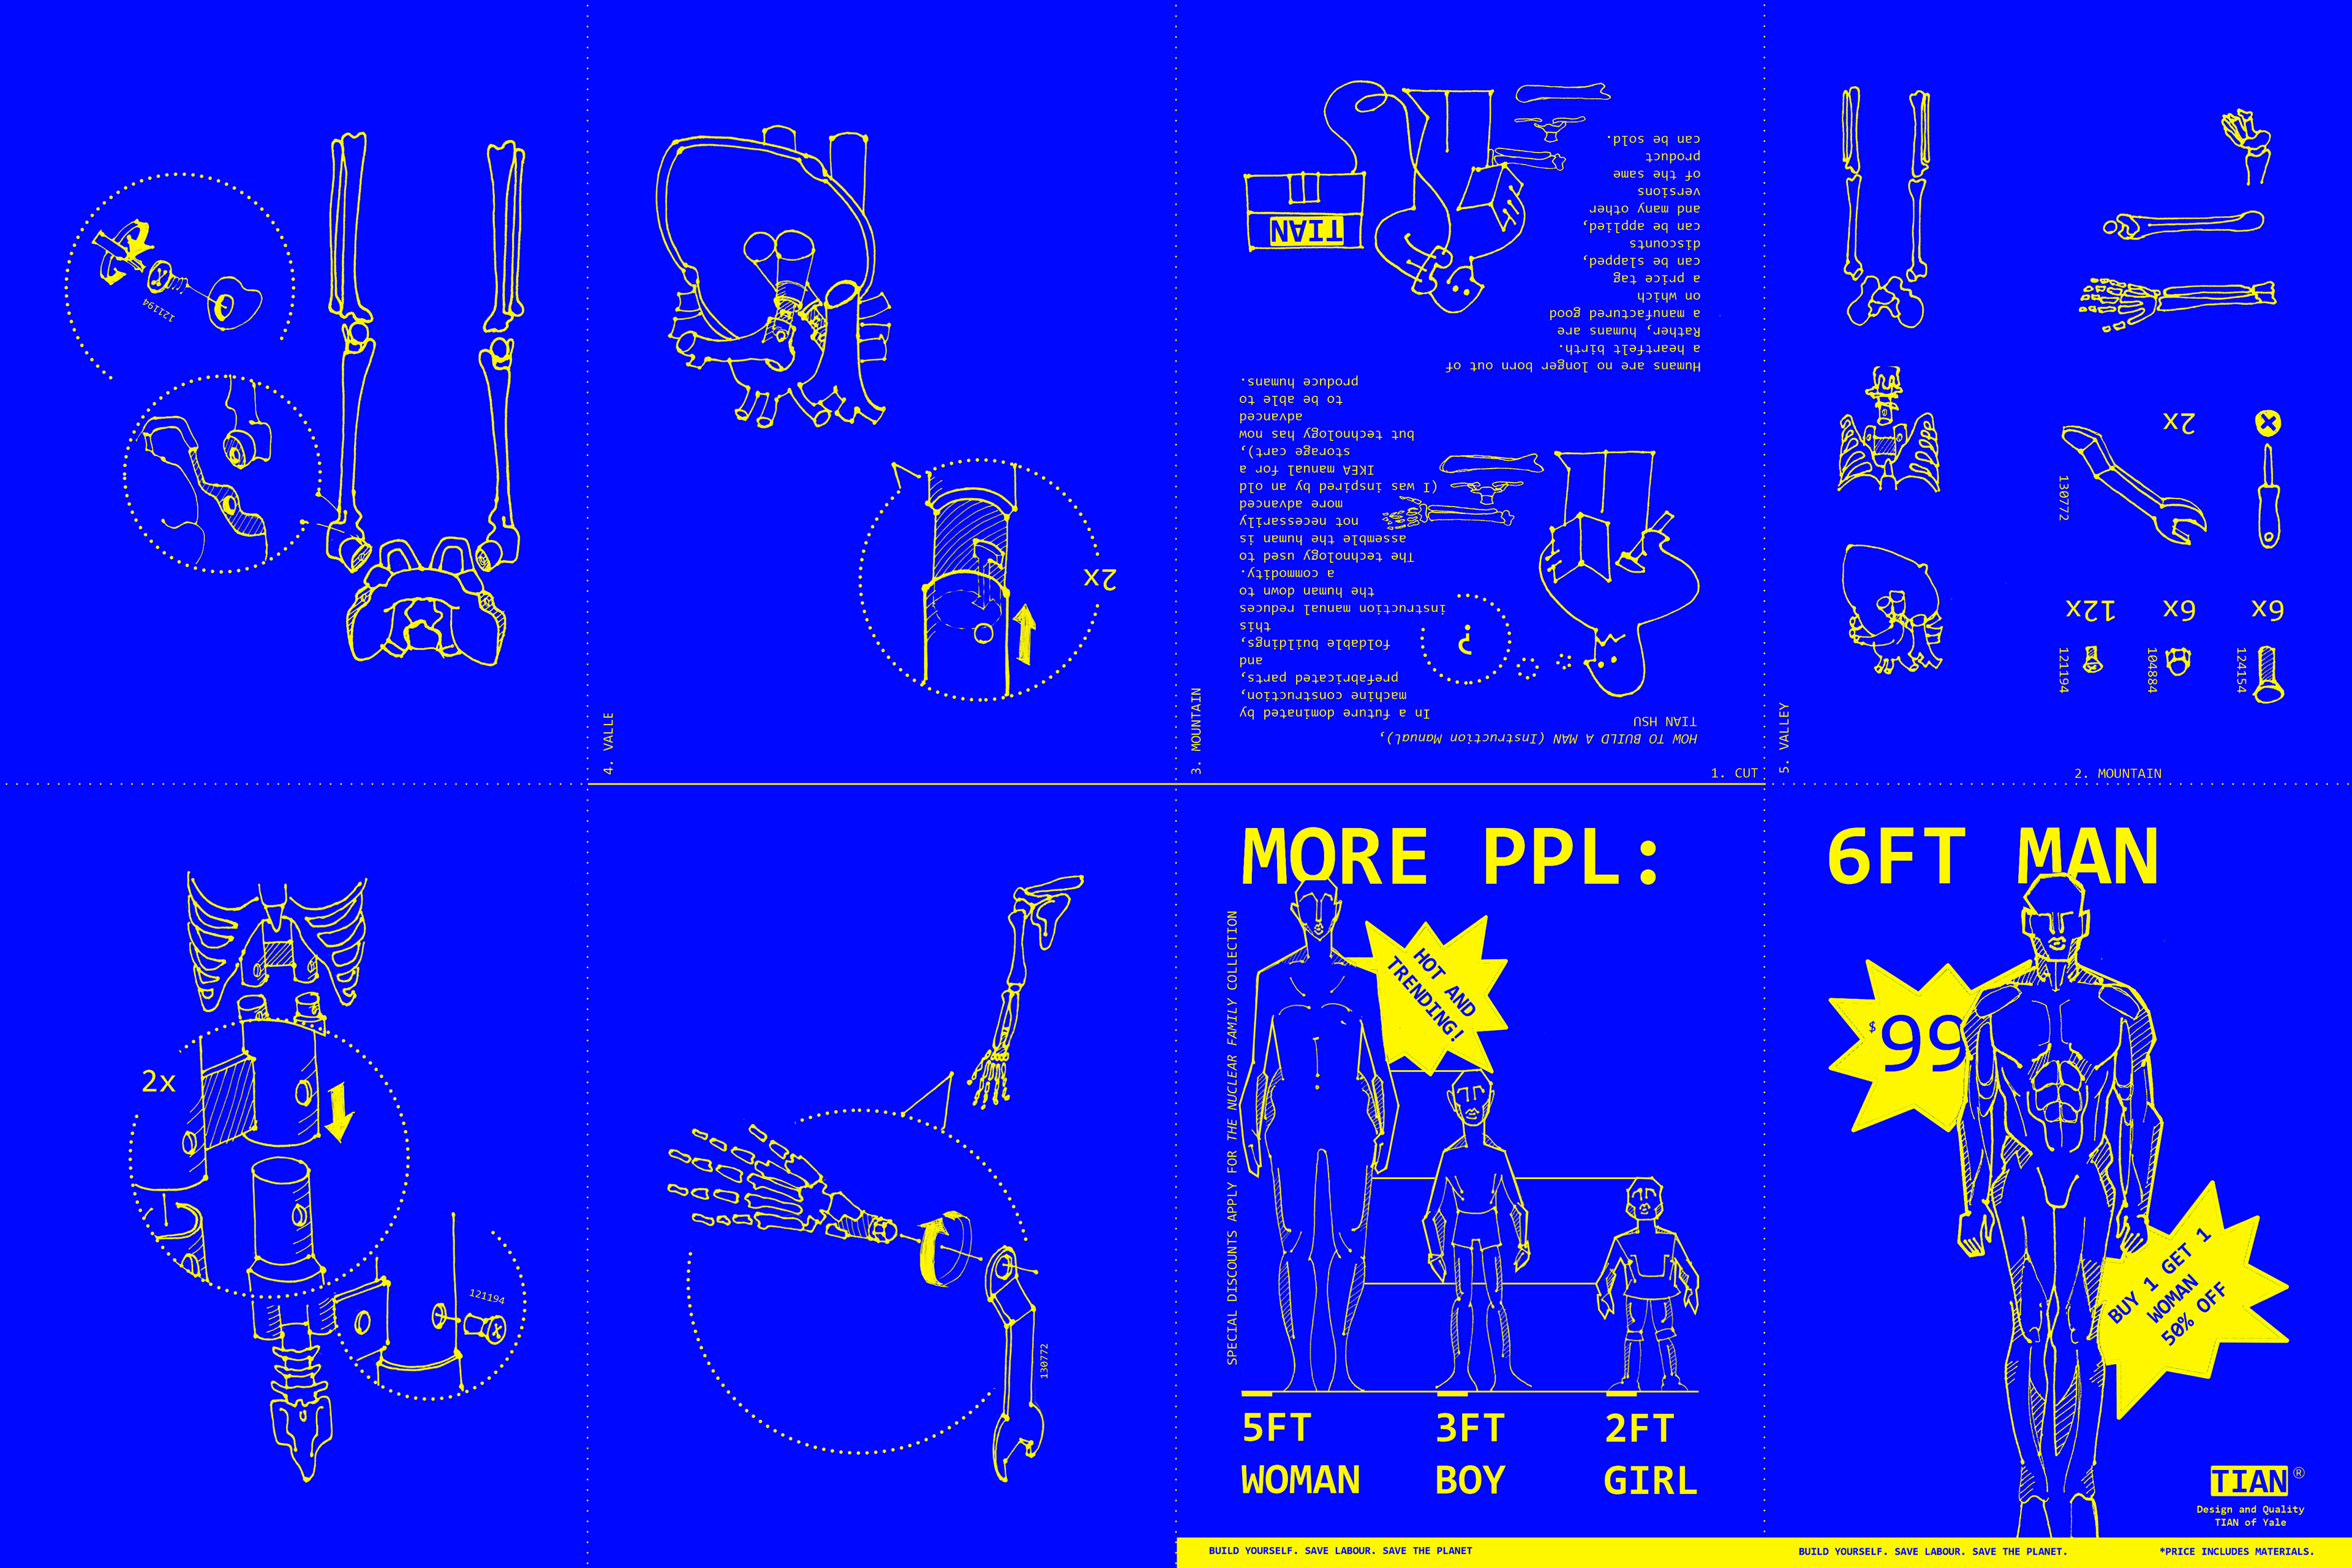


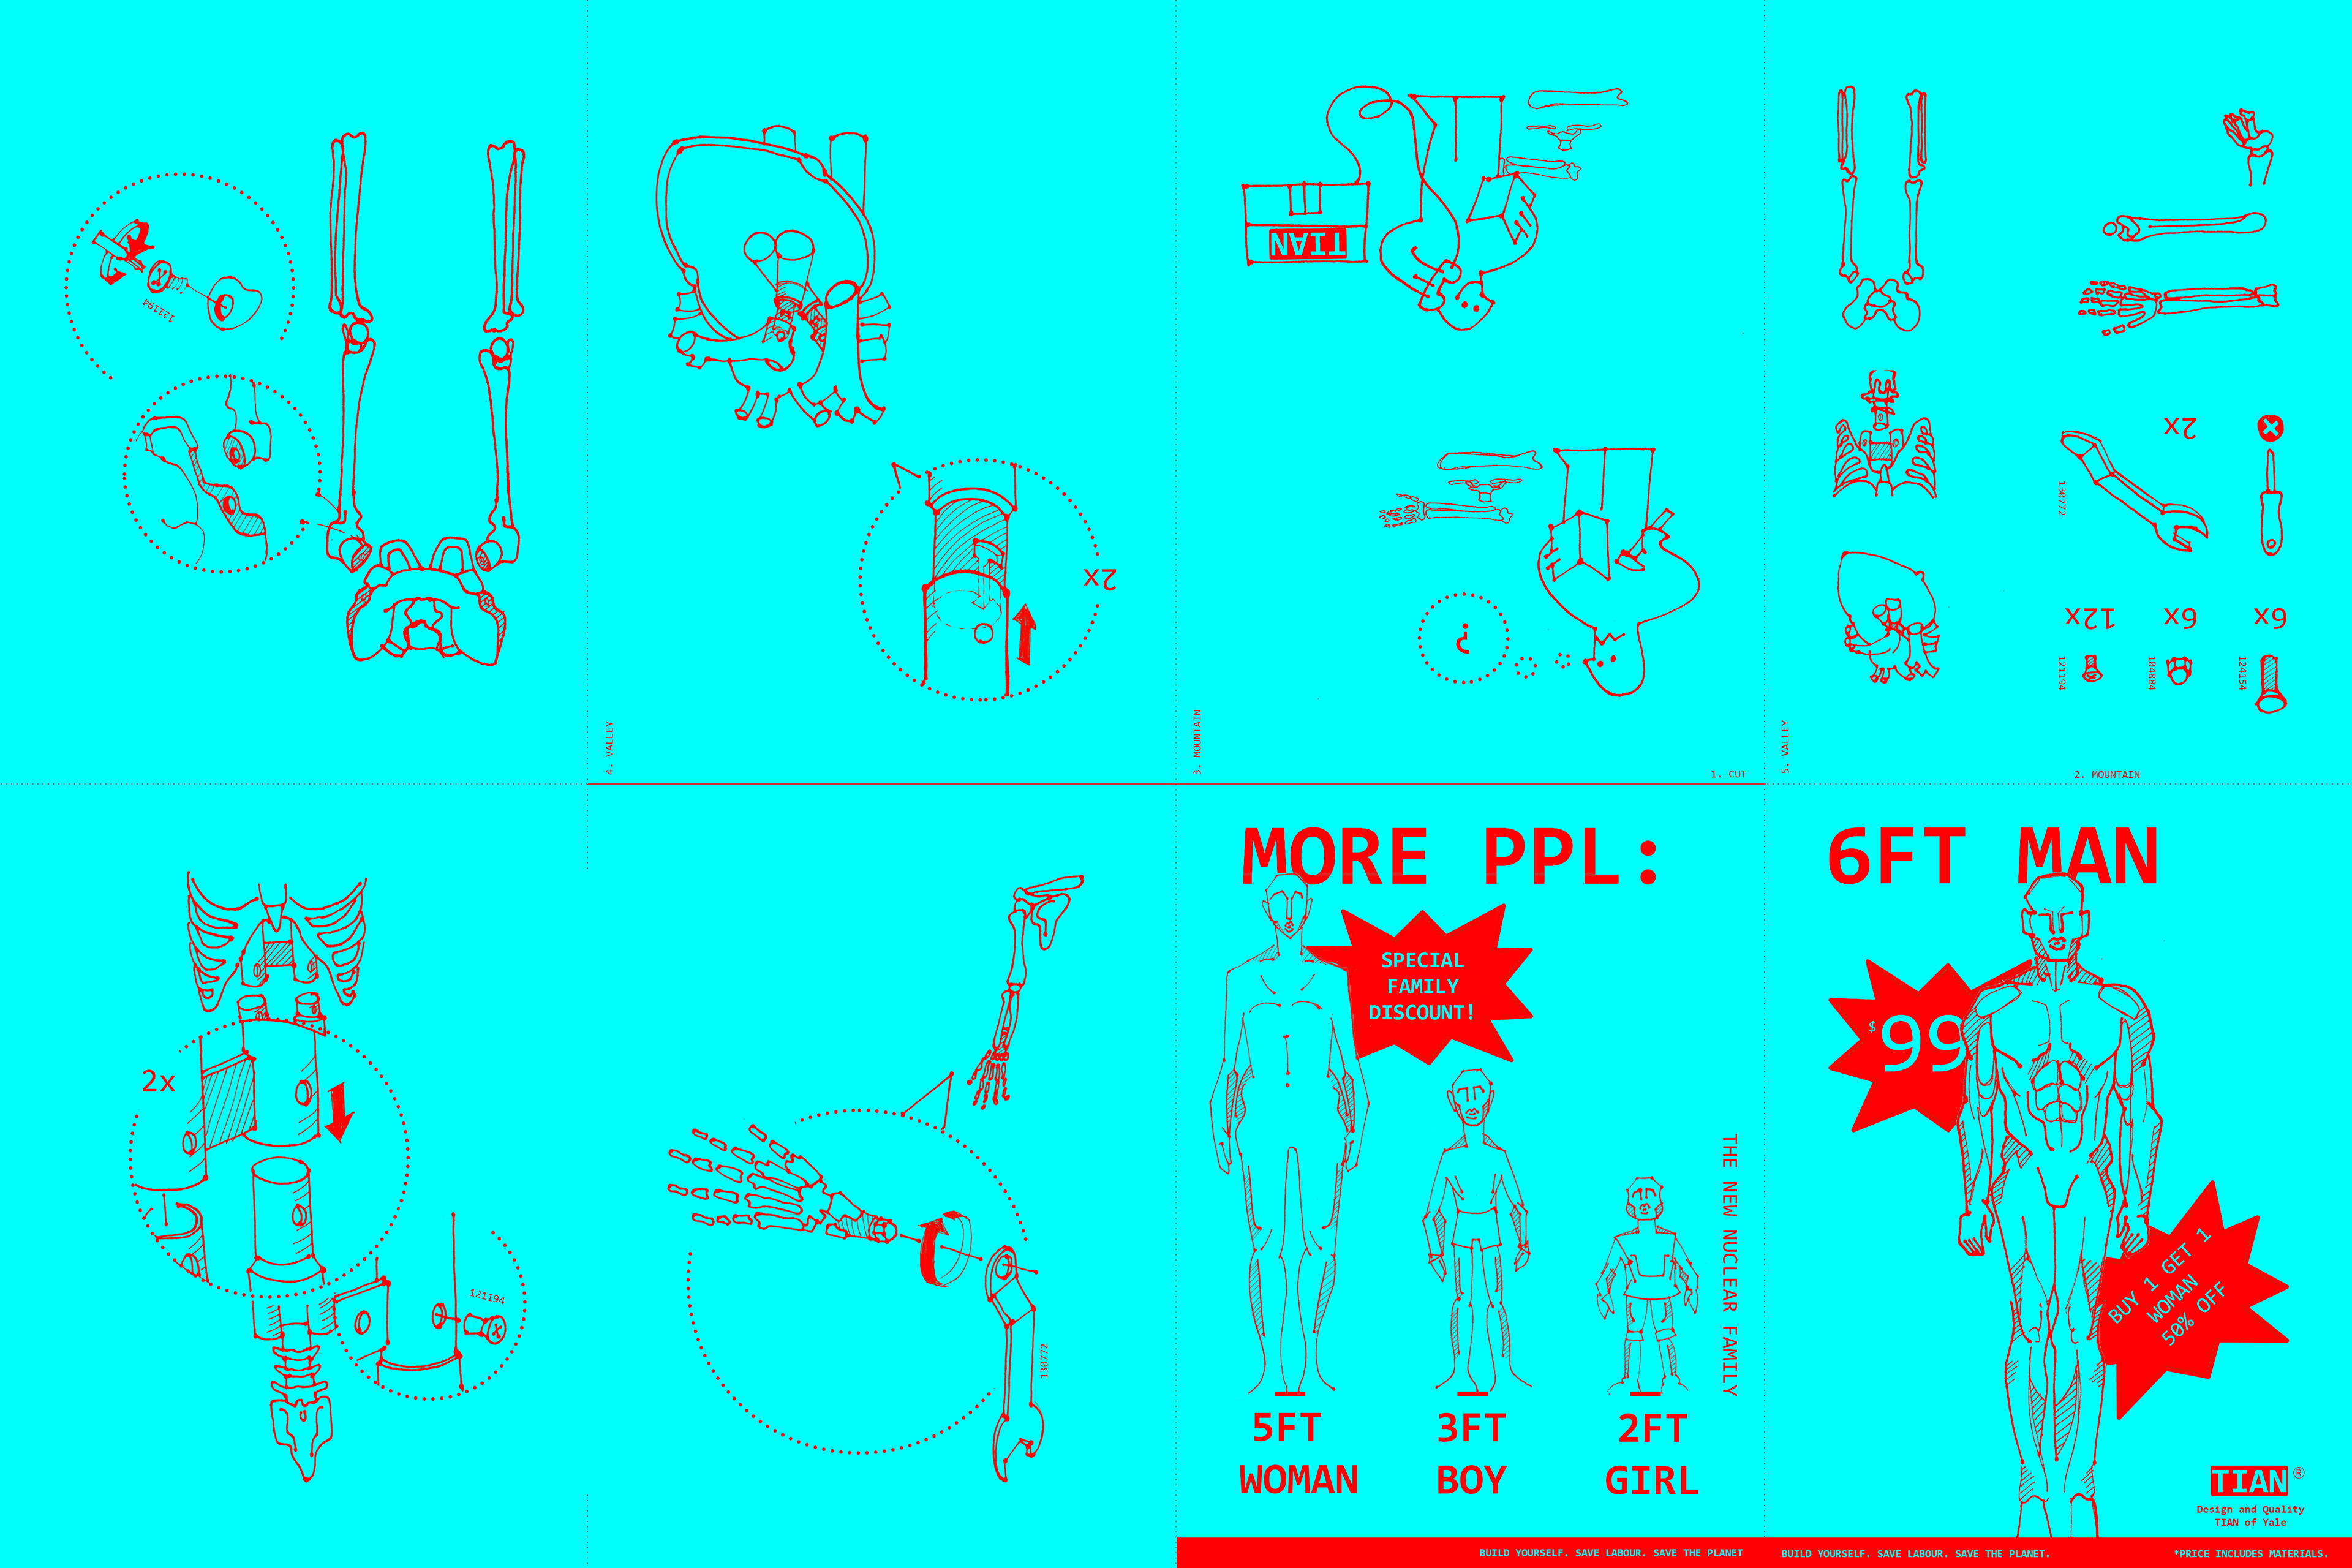
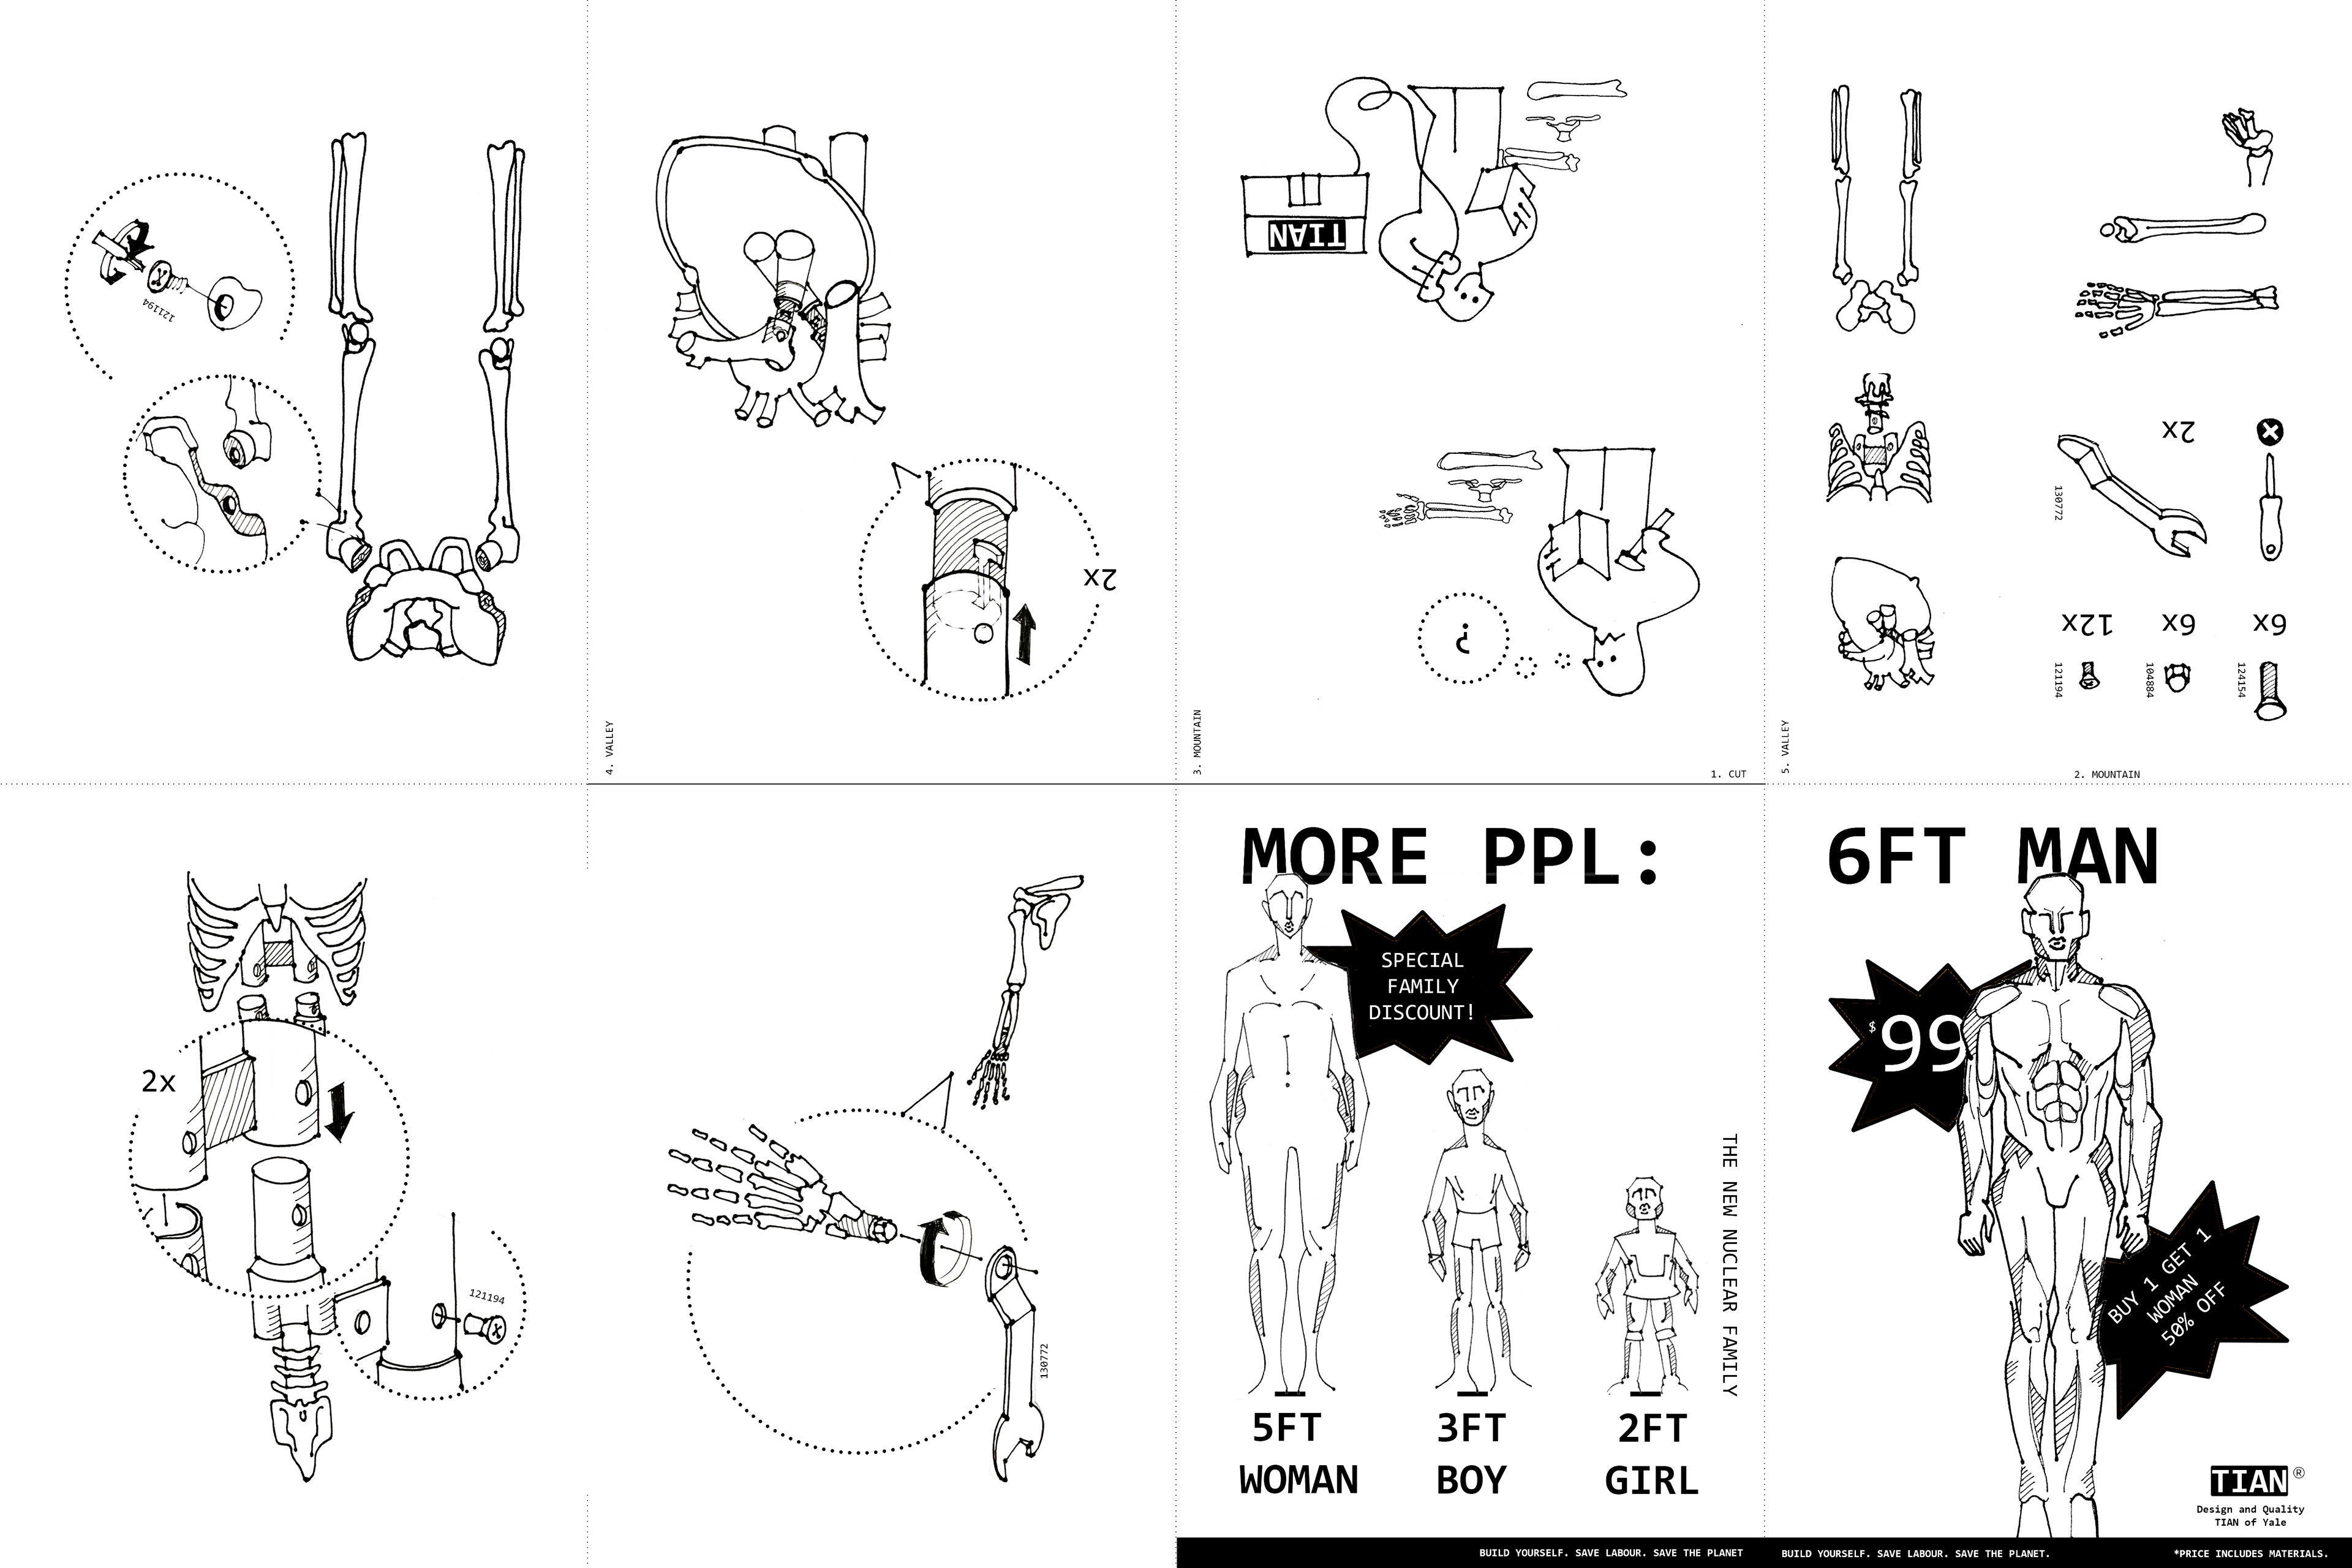
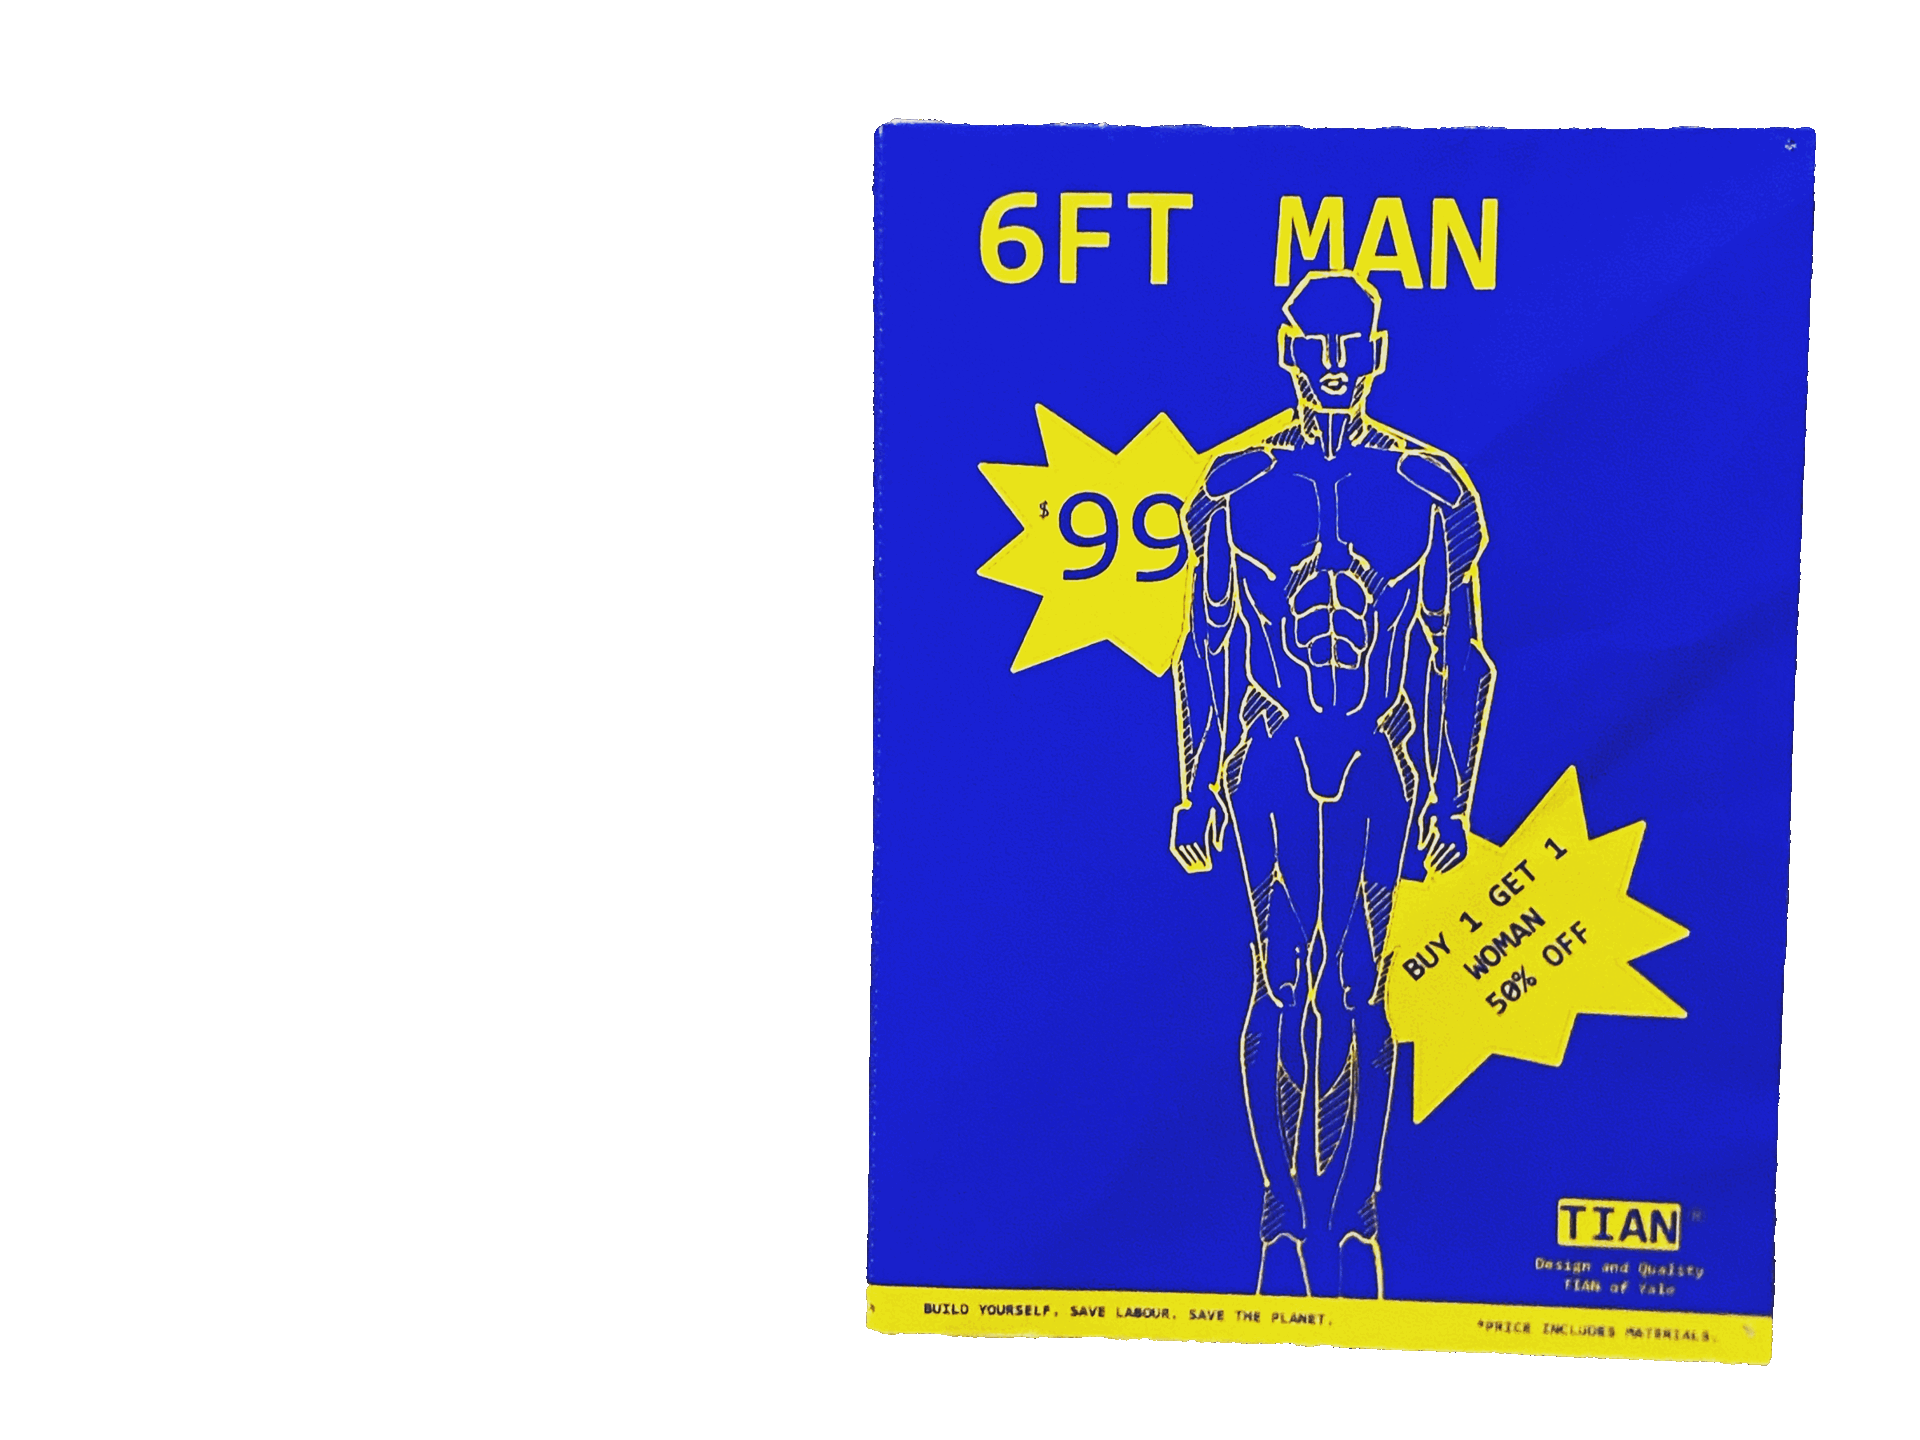
HOW TO BUILD A HUMAN (INSTRUCTION MANUAL)
Hand-drawn and Adobe Photoshop, 11"x17" paper
In a future dominated by machine construction, prefabricated parts, and foldable buildings, this instruction manual reduces the human down to a commodity.
I was inspired by an old IKEA manual for a storage cart and the mechanics of slotting, screwing, and assembling a simple household item. In the world in which this zine exists, the technology used to assemble the human is not necessarily more advanced, but the way in which we use technology has significantly evolved. Humans are no longer born out of a heartfelt birth. Rather, humans are a manufactured good on which a price tag can be slapped, discounts can be applied, and many other versions of the same product can be sold.
SOUTH CHINA SEA DIORAMA
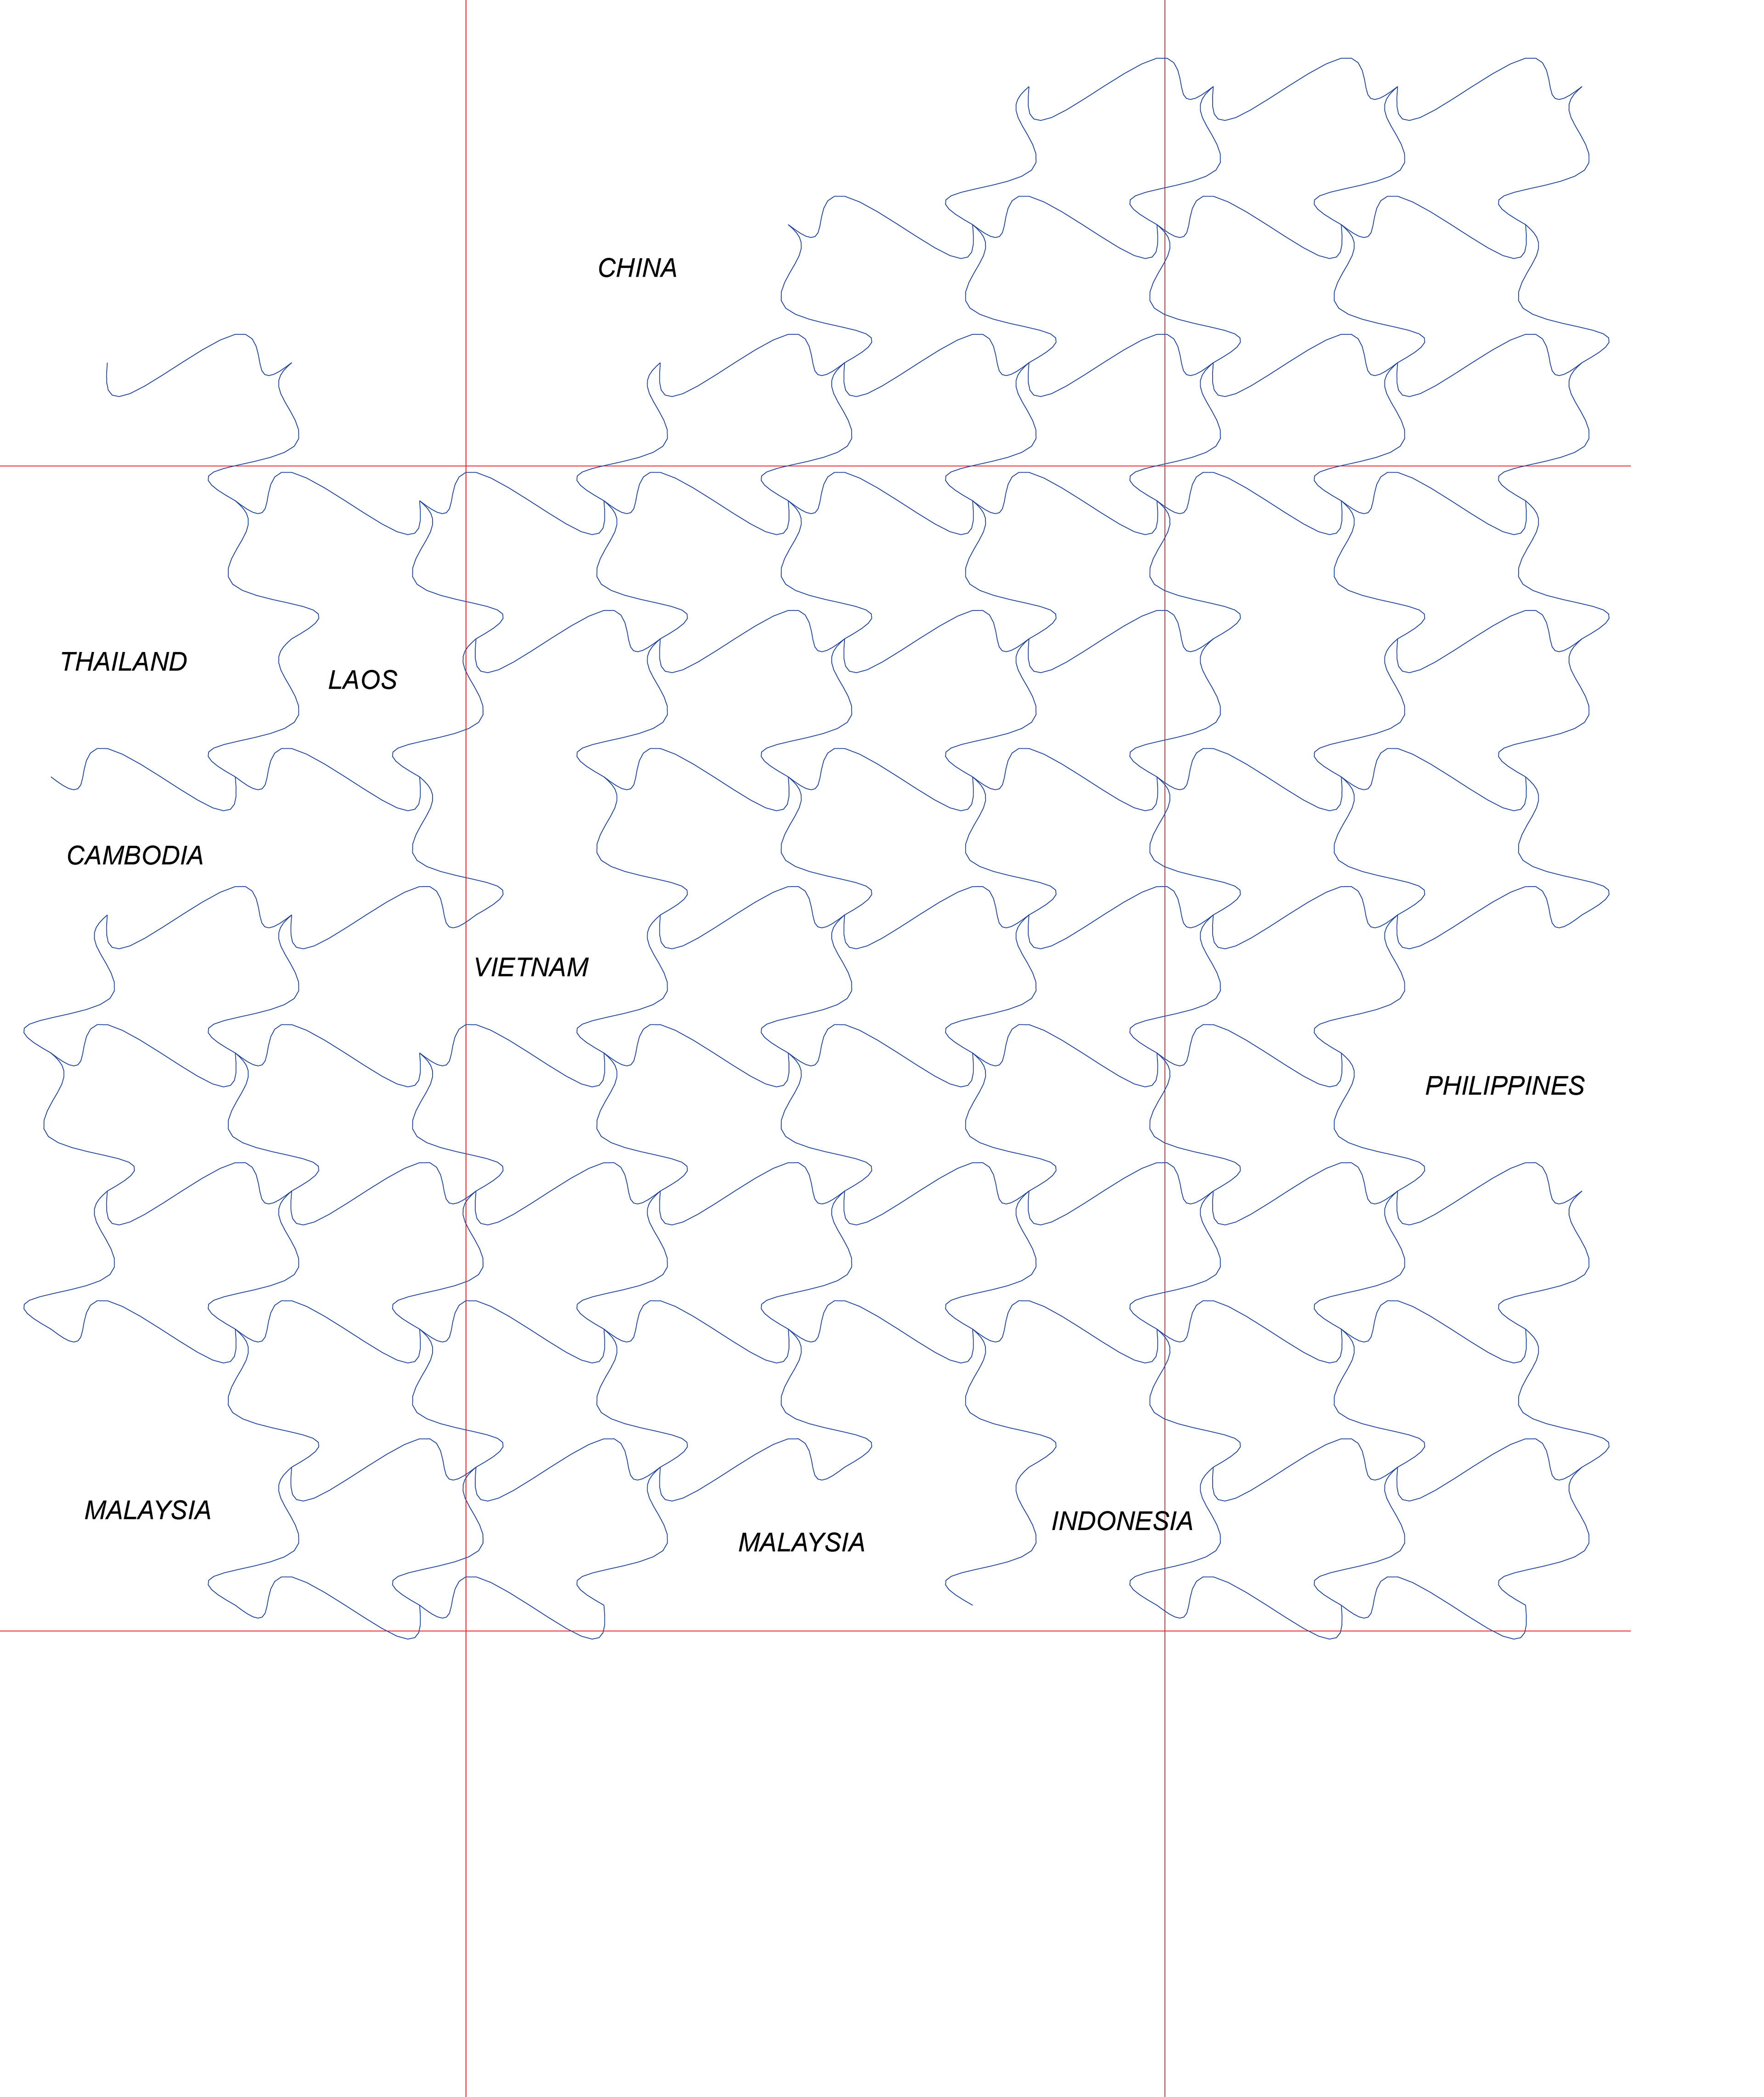
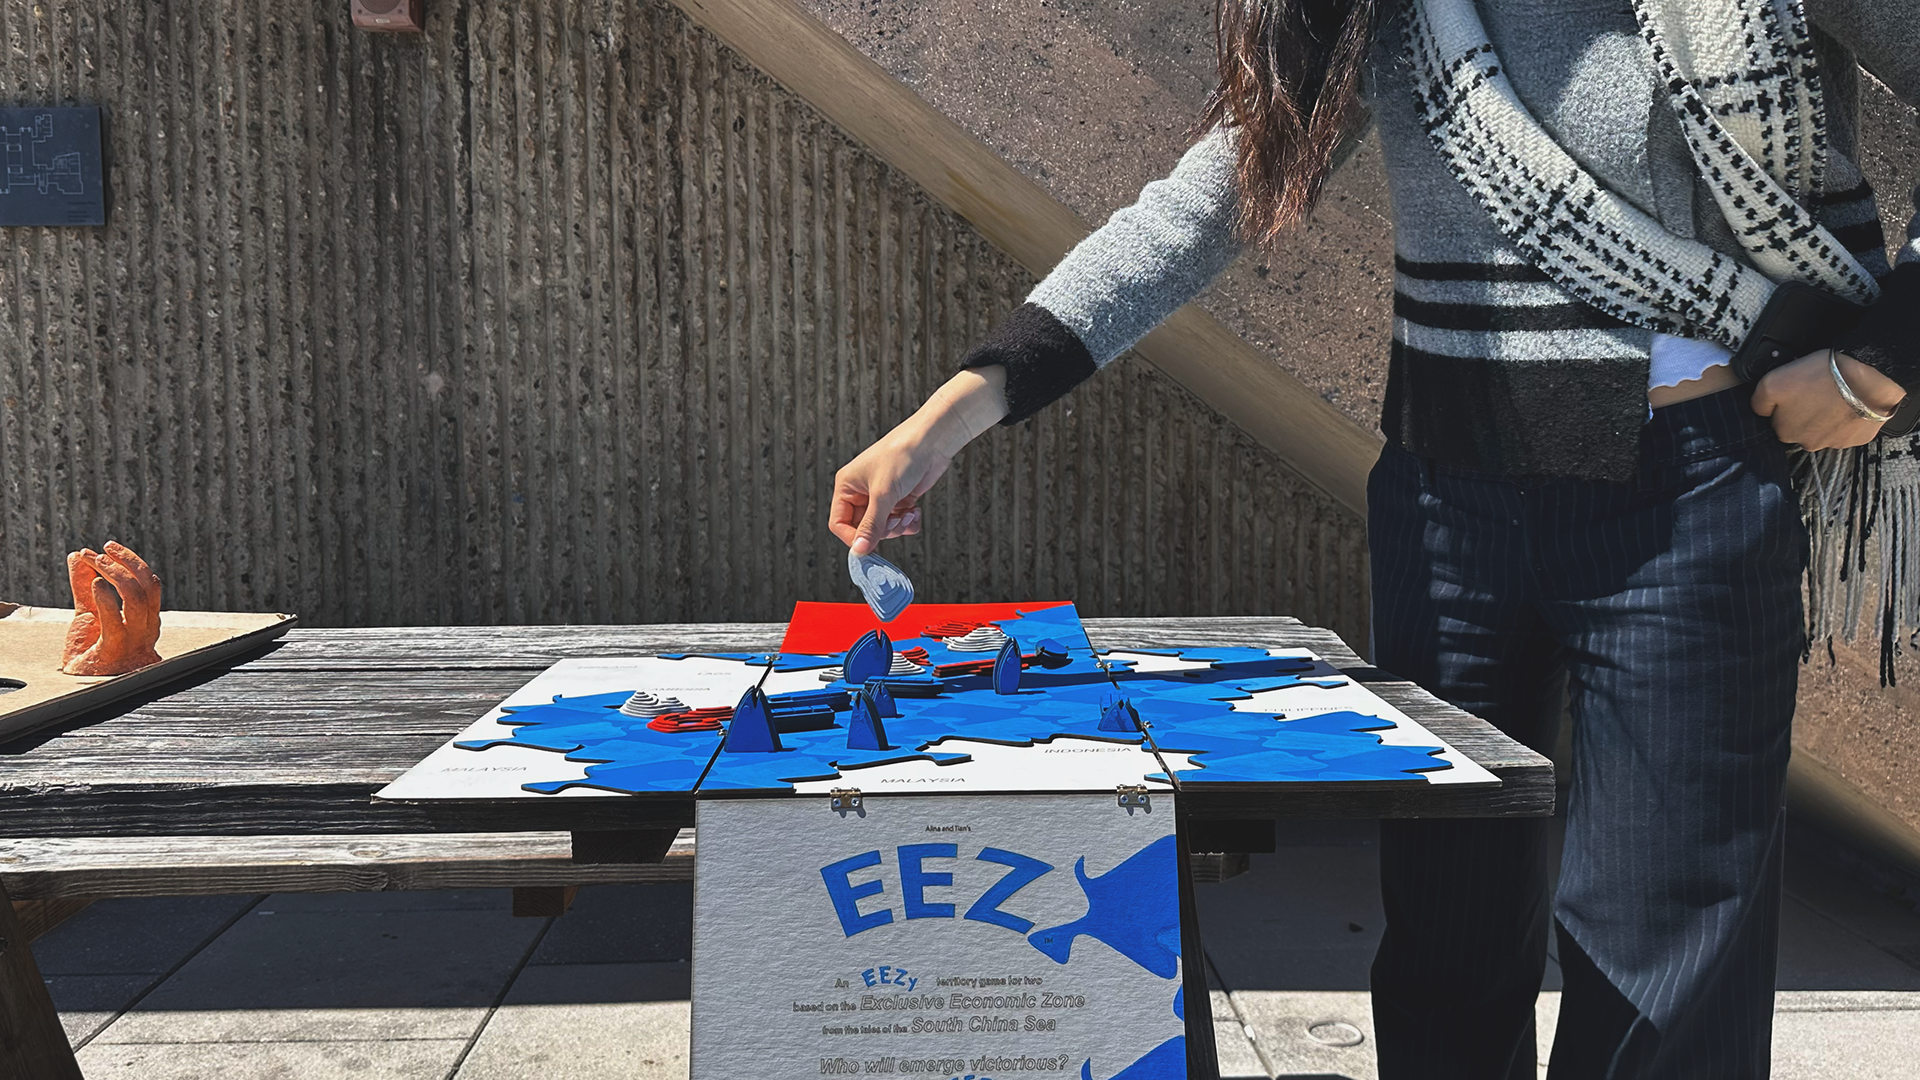

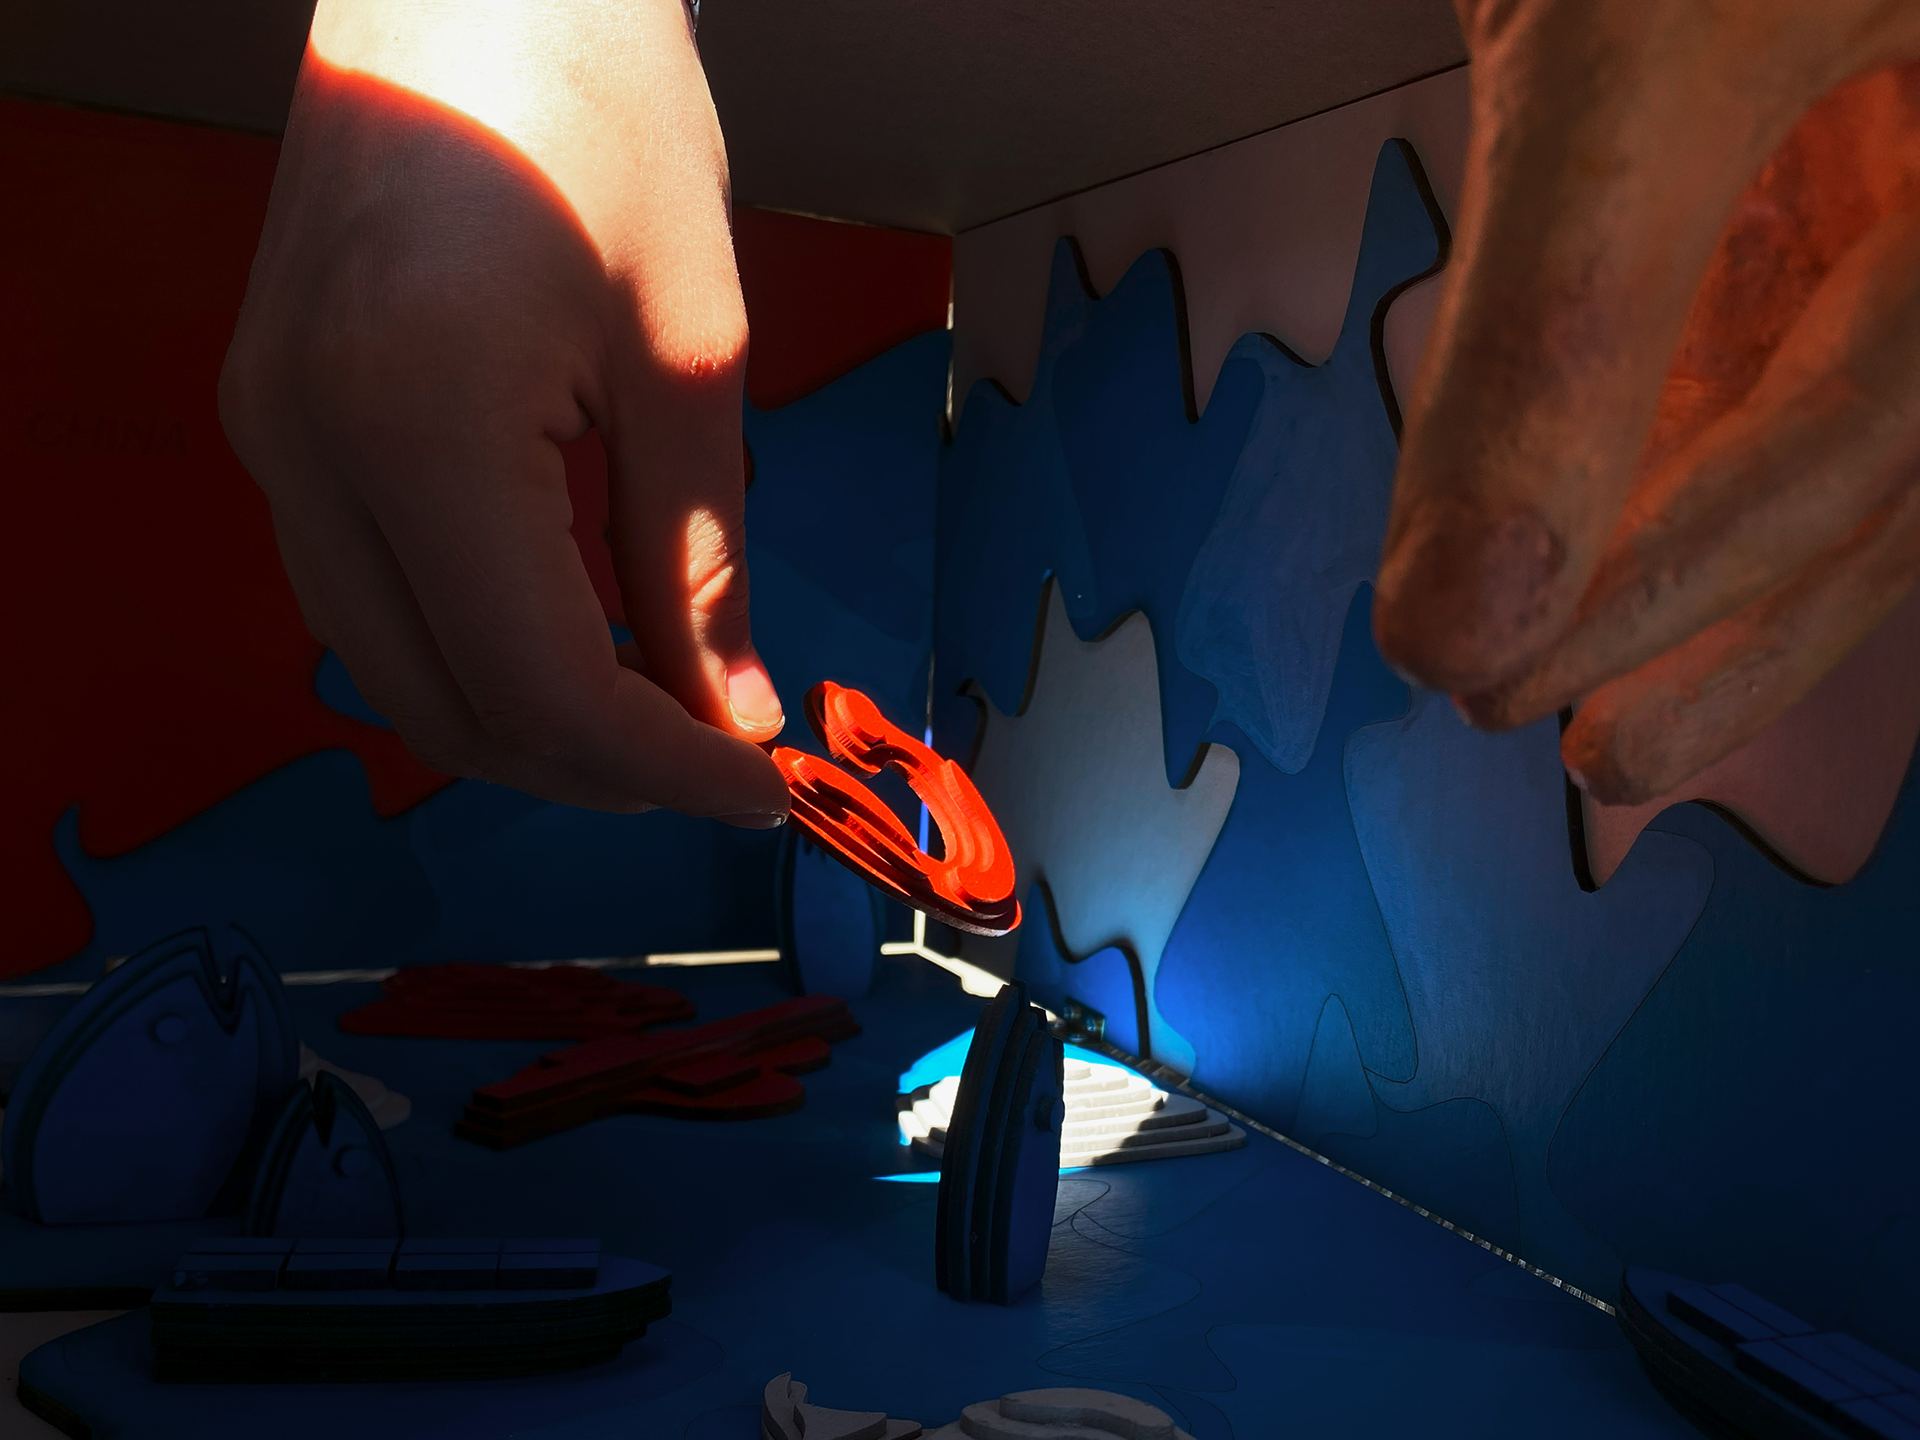
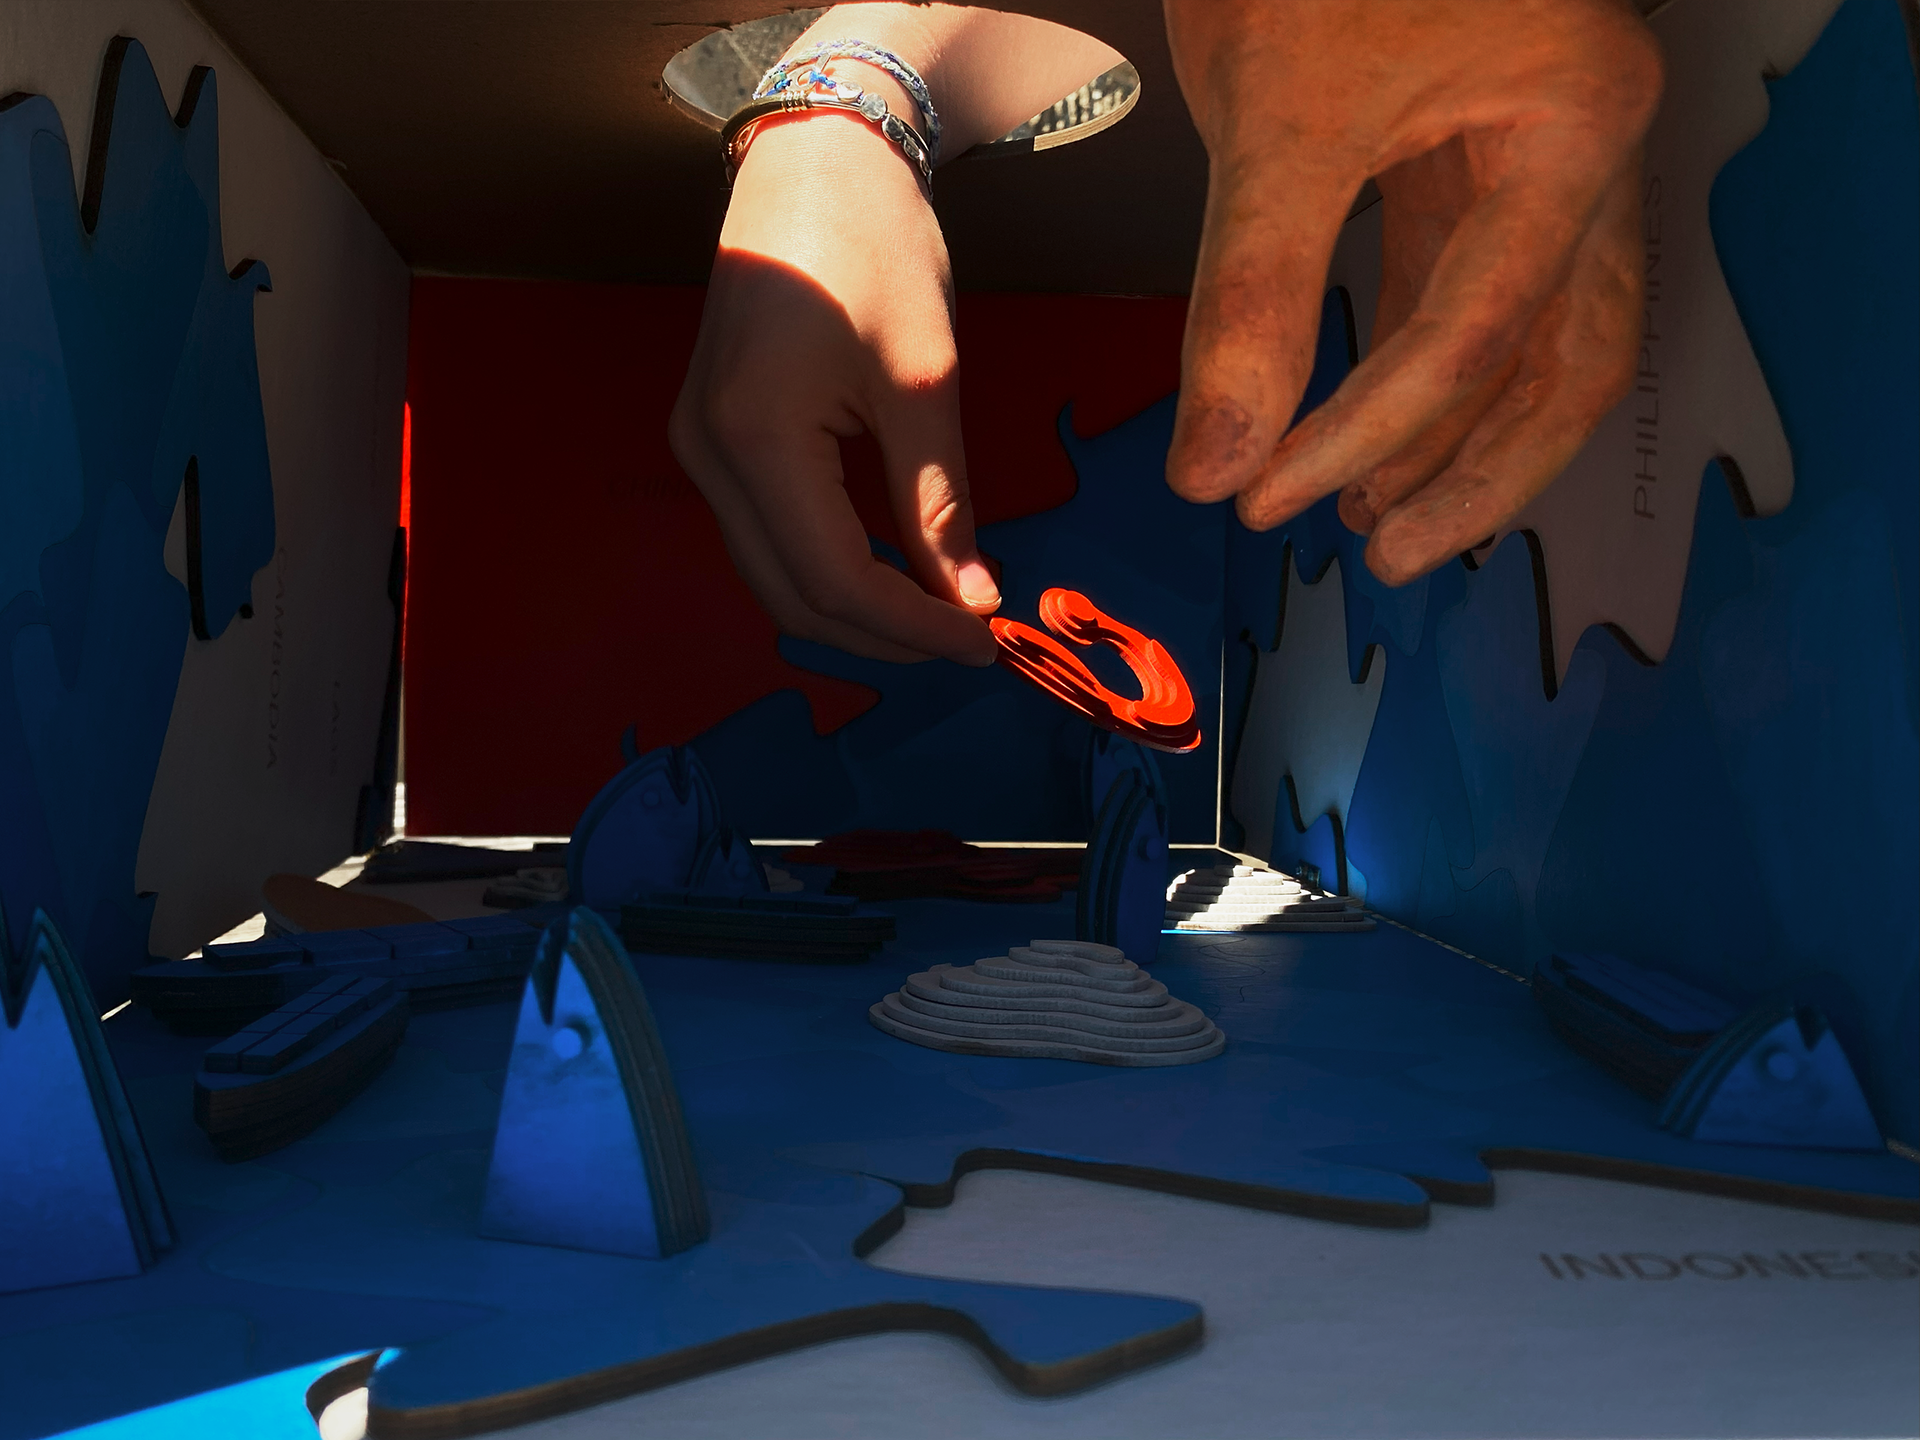


EEZ (Exclusive Economic Zone)
Diorama of the South China Sea Conflict
with Alina Susani Yale College '26
Our goal for this diorama was to portray the territorial disputes in the South China Sea, or the Exclusive Economic Zone (EEZ), by showing the physical and metaphorical manipulation of the islands in this area. As you look through the opening, China’s presence is glaring and obvious, representing her aggressive and imposing role in this dispute. The diorama unfolds, and as it does so reveals the other countries involved in the South China Sea conflict. These countries are China’s opponents both in real life and in this playable game.
MAP OF THE WORLD
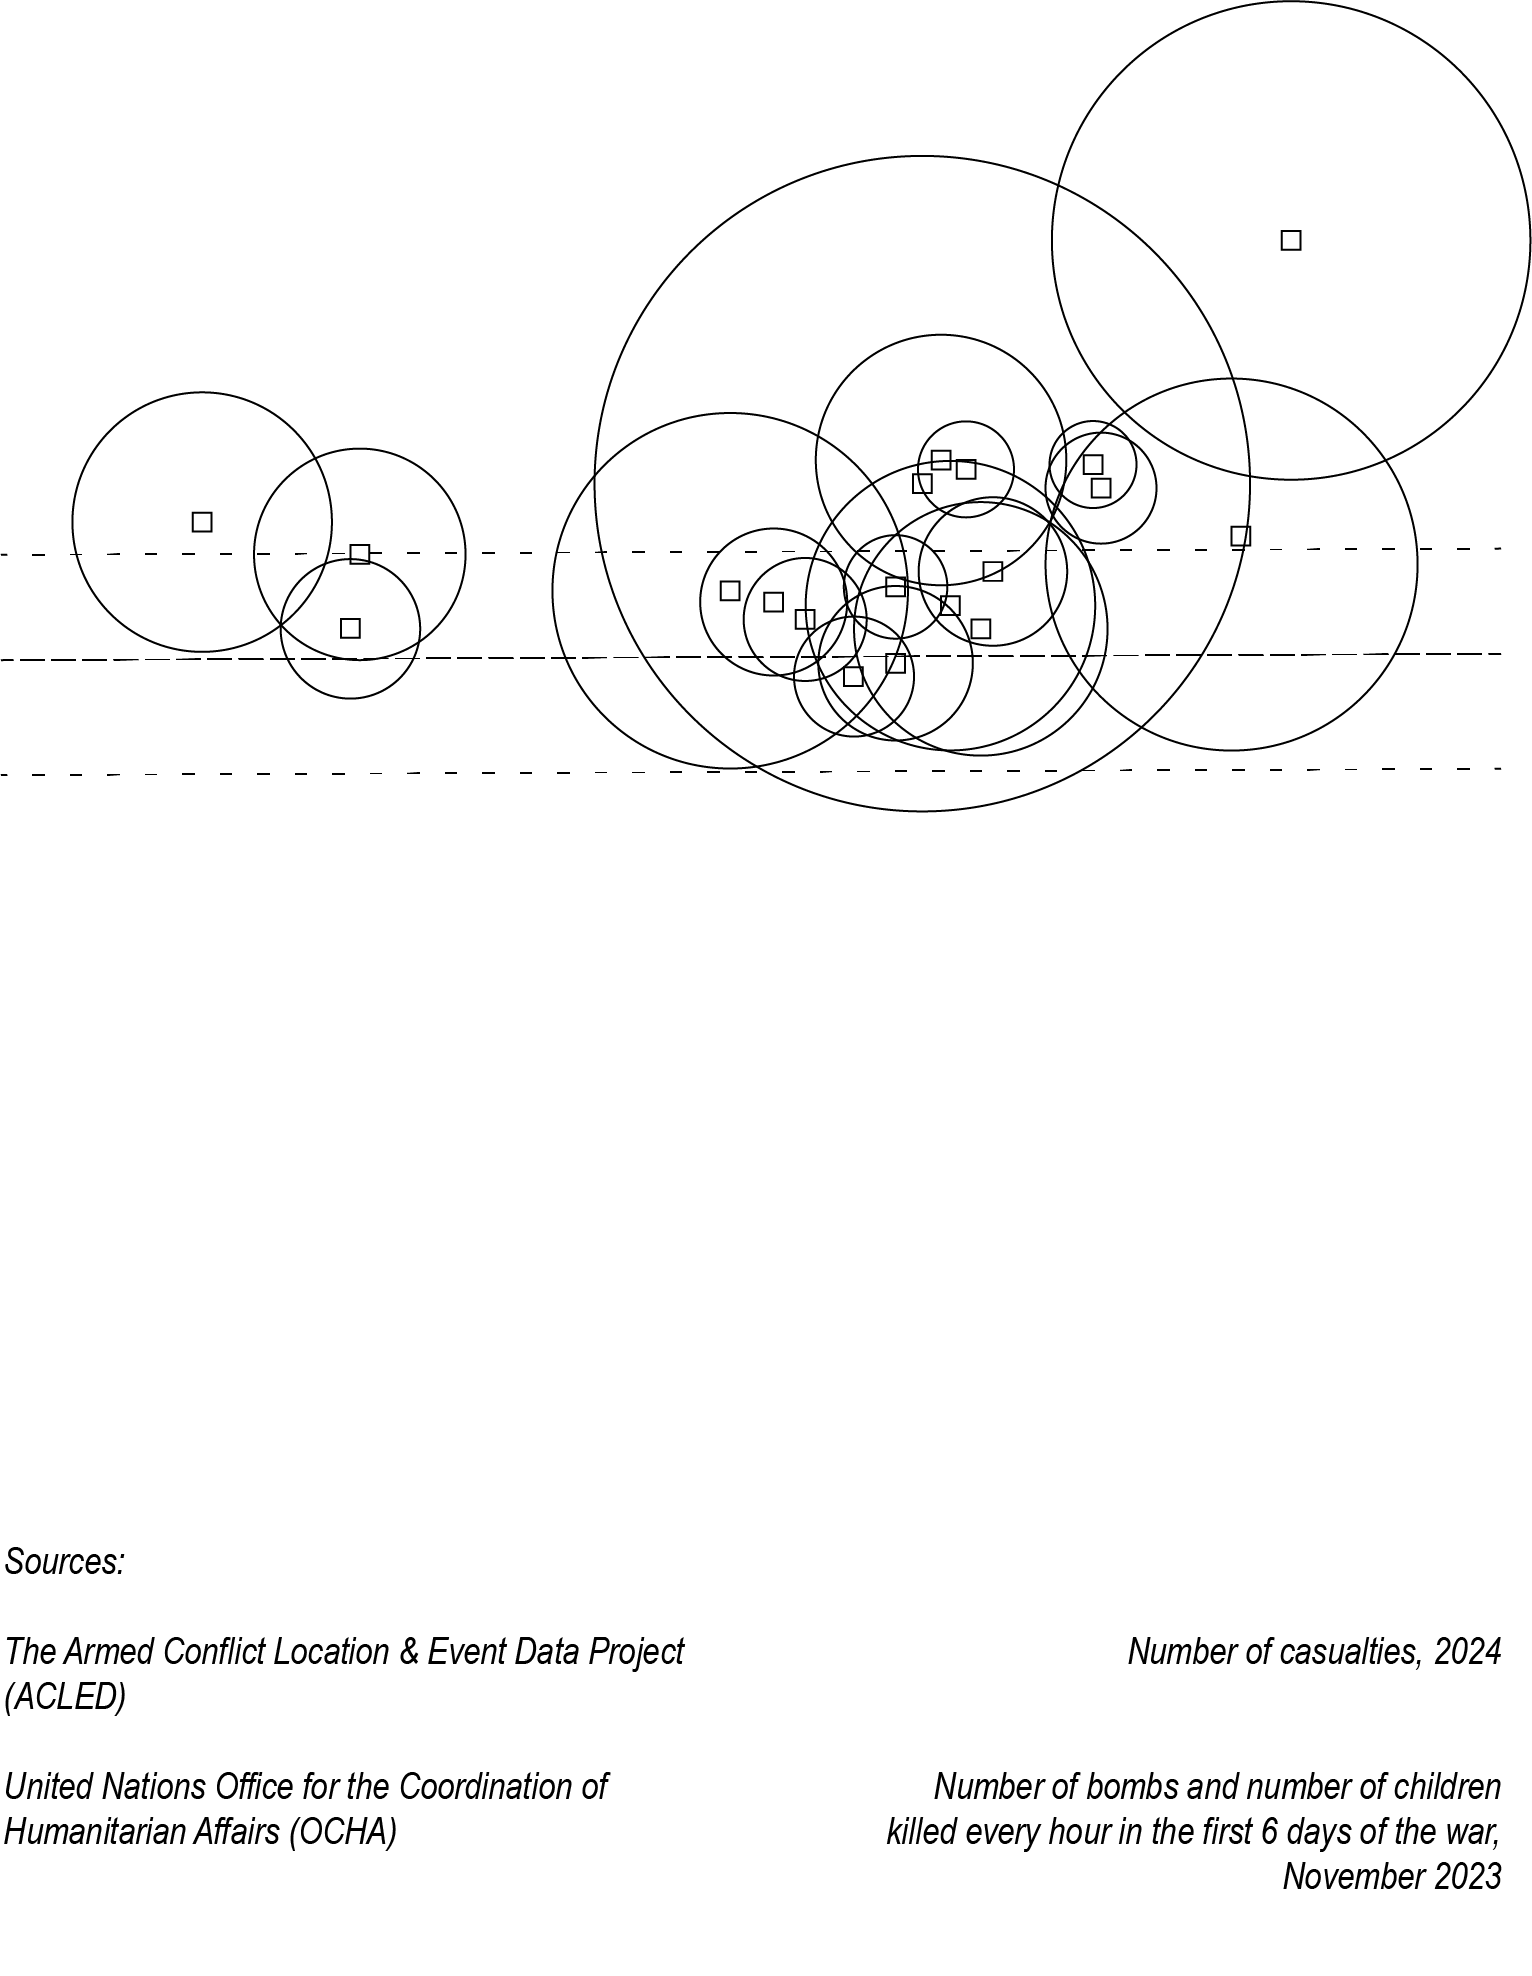
1 HOUR IN THE GAZA STRIP IN 10 SECONDS (PRESS THE BUTTON)
Paper, Wooden dowel, Adobe Illustrator 11"x17" Museum board
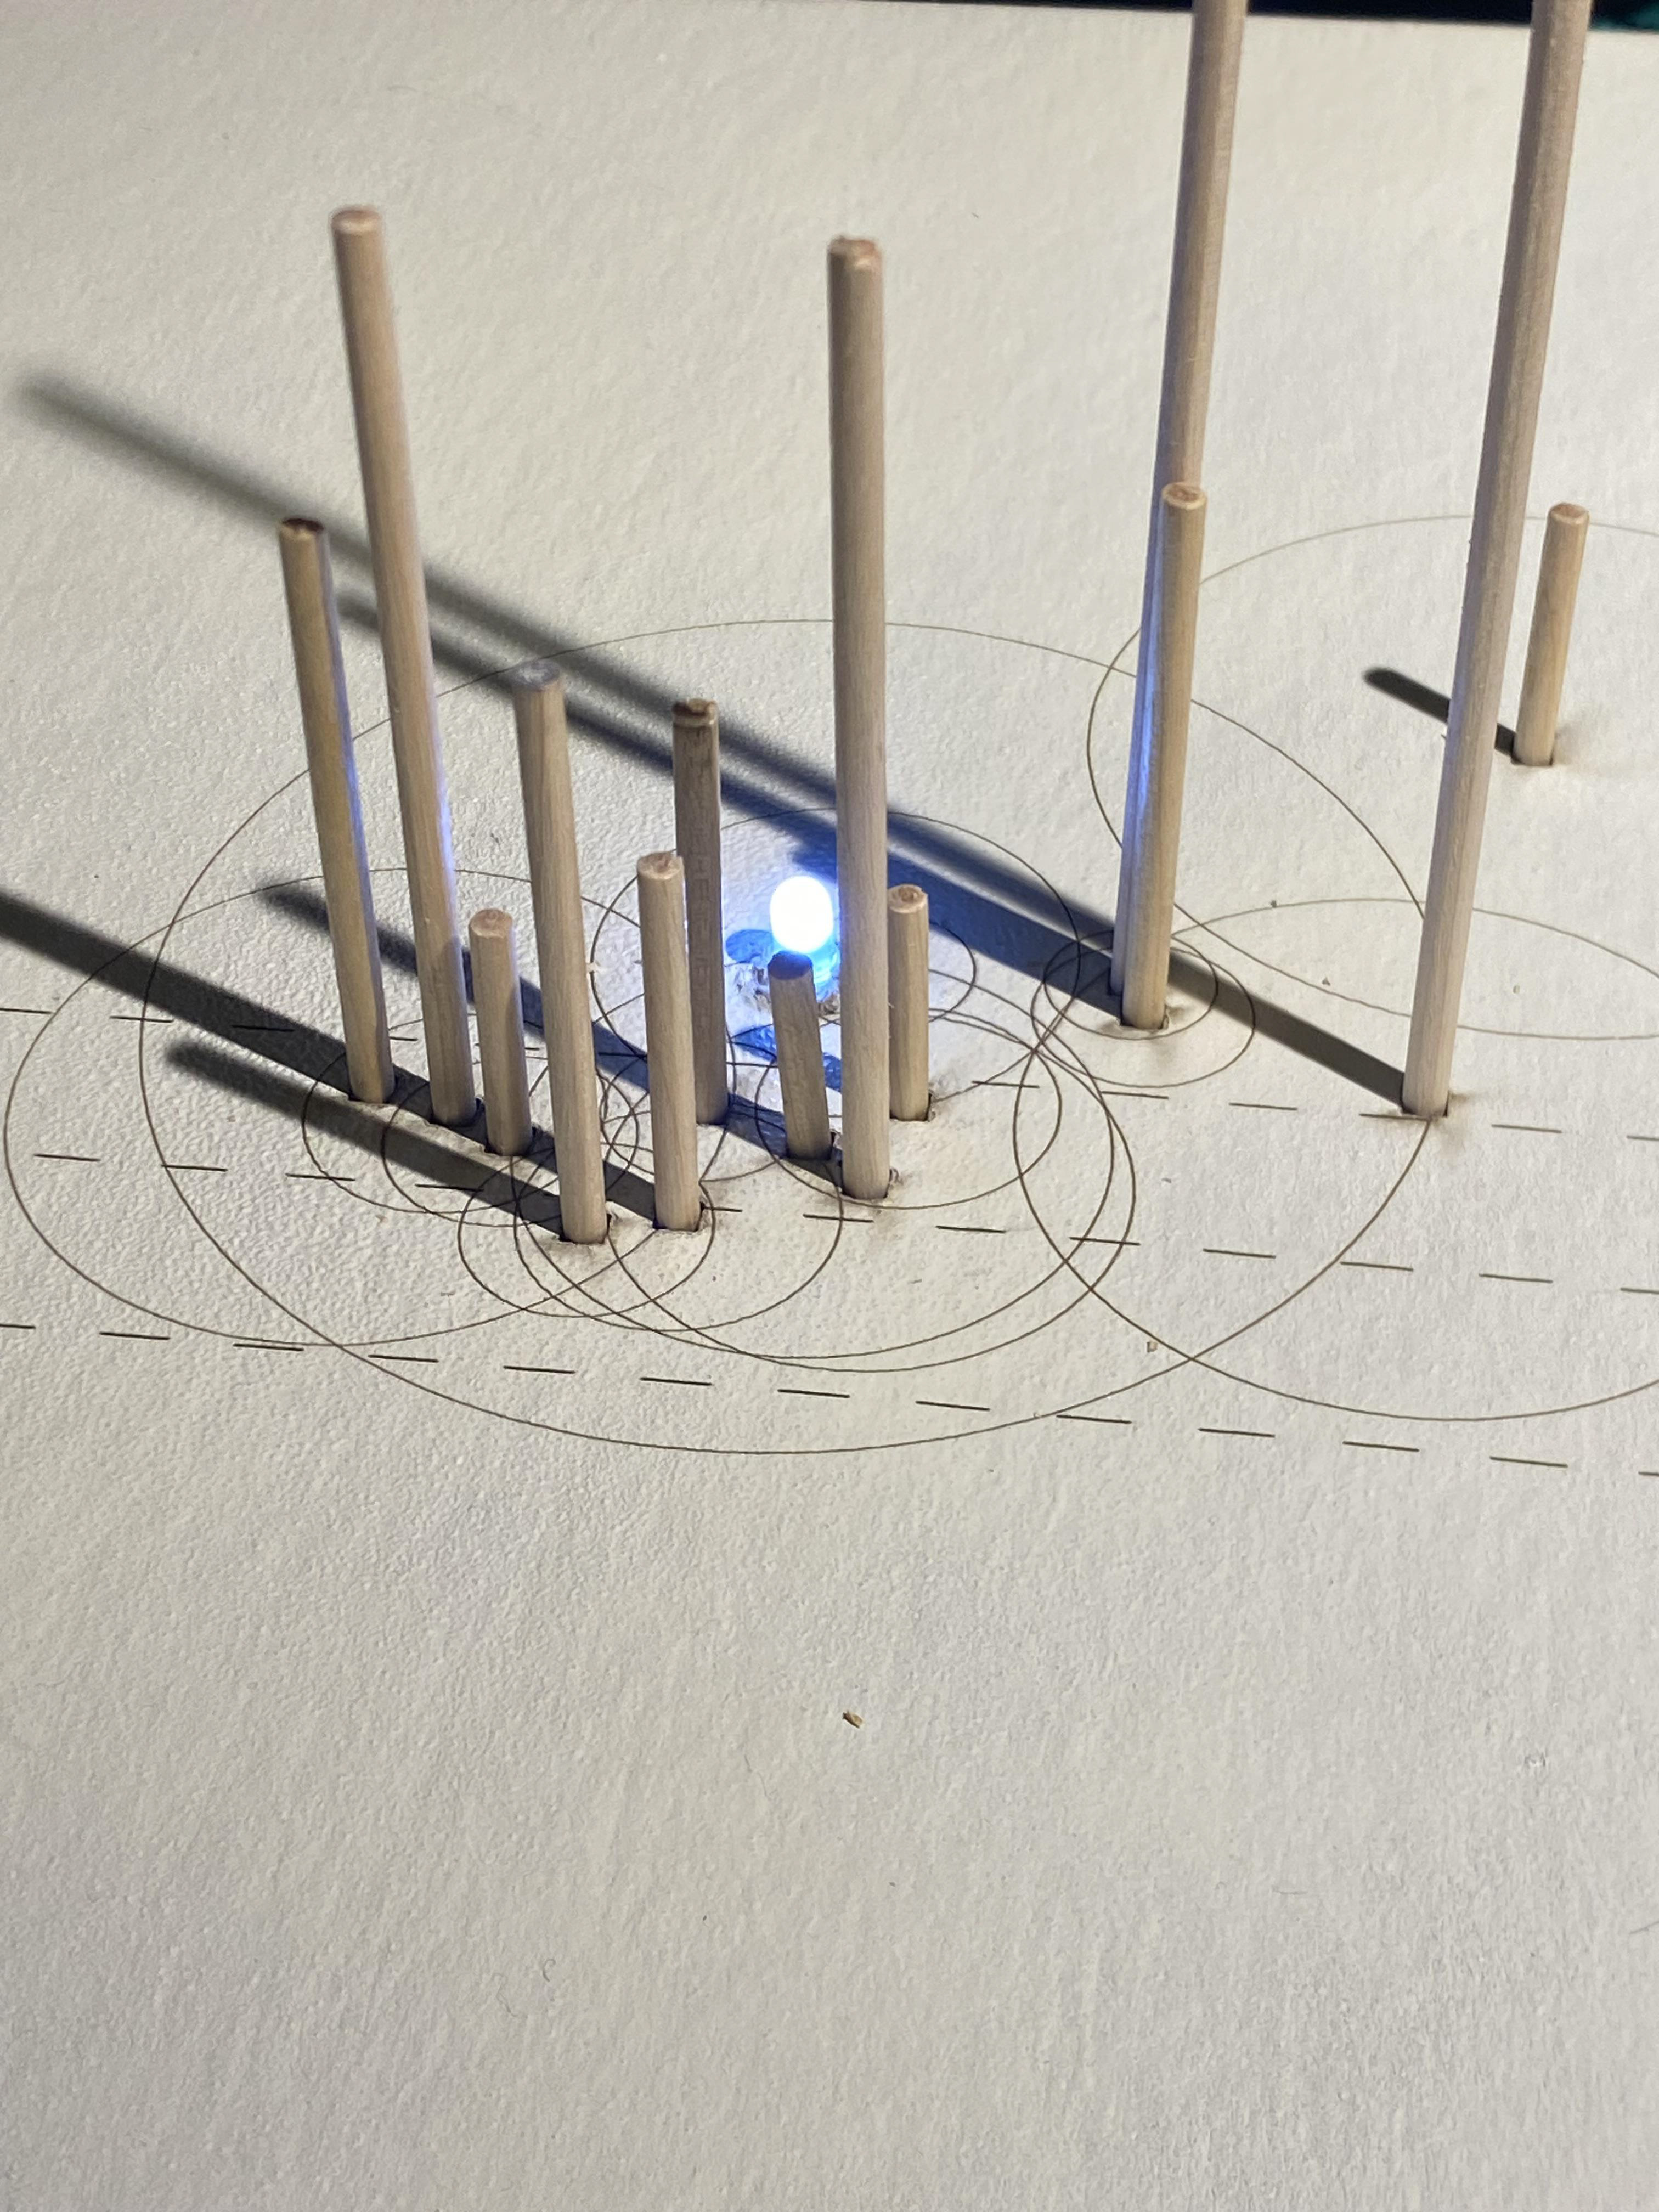
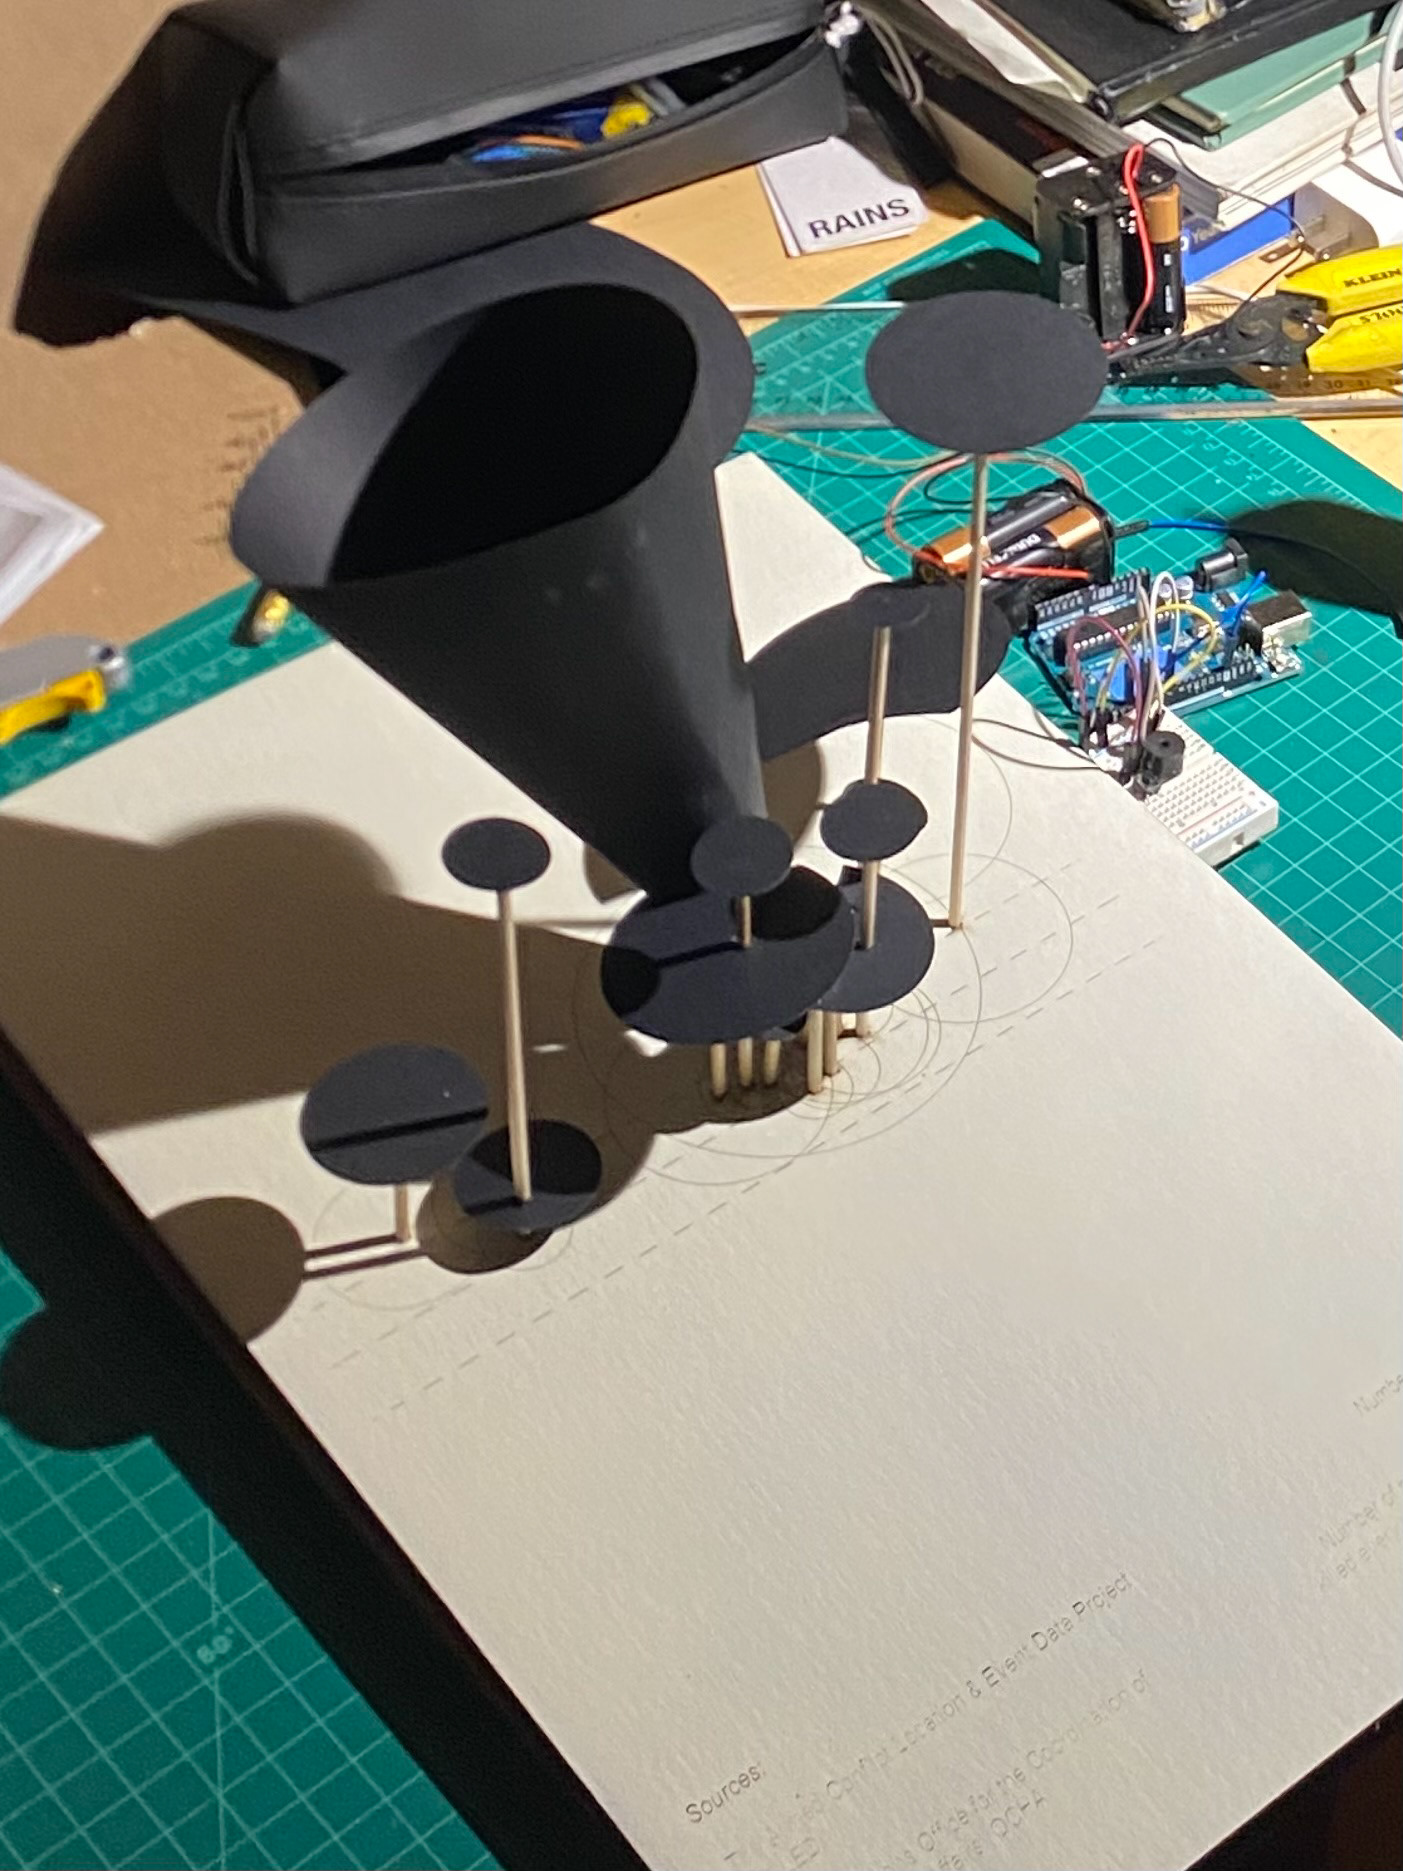

This map geographically depicts ongoing conflicts in the world and compares them in two different time frames: 1) the long-term scale of present-day conflicts with over 10,000 cumulative casualties, 2) the short-term scale of every hour in the first 6 days of the Israel-Hamas war condensed into 10 seconds. Upon pressing the button, the user activates the buzzer and light to go off 42, then 6 times before resetting. This represents the 42 bombs that were dropped and 6 children that died every hour in the first 6 days of the ongoing Israel-Hamas war. In engaging the user, it makes the user more intentionally think about the violence currently occurring in the Gaza strip and the impact this has on people’s lives.
While this map highlights the war in the Gaza strip, it also reminds us that other conflicts continue to exist across the world. The Israel-Palestine conflict is not represented as a circle, but as a three-dimensional megaphone with a light emitting from its center. I wanted to also point out that media portrayal does not necessarily correlate to ongoing length of time or number of casualties.
The following calculations have been used:
Length of the conflict since present-day (in years) ÷ 10 = Distance from the wall (in inches)
Number of casualties of the conflict this year ÷ 1000 = Area of the circle (in inches squared)
The following sources have been used:
The Armed Conflict Location & Event Data Project (ACLED)
United Nations Office for the Coordination of Humanitarian Affairs (OCHA)